post
https://cloud.getwren.ai/api/v1/generate_vega_chart
Generates a Vega chart spec for data visualization from a question and SQL query
Recent Requests
Log in to see full request history
| Time | Status | User Agent | |
|---|---|---|---|
Retrieving recent requests… | |||
Loading…
The /generate_vega_chart endpoint analyzes your question and data to produce an optimized visualization specification. It intelligently selects the appropriate chart type, colors, and layout based on your data characteristics and question intent.
Key Features
- Automatic chart selection: Chooses the best visualization type based on your data
- Embedded data: Results are included in the specification for immediate rendering
- Customizable instructions: Use
customInstructionto request specific chart tweaks (e.g., renaming titles, sorting, changing chart type)
Wren AI charts are based on Vega Lite Spec, learn how to render Vega Lite charts.
Example
Response will be a Vega spec you could render with the Vega library. For example:
{
"projectId": 1,
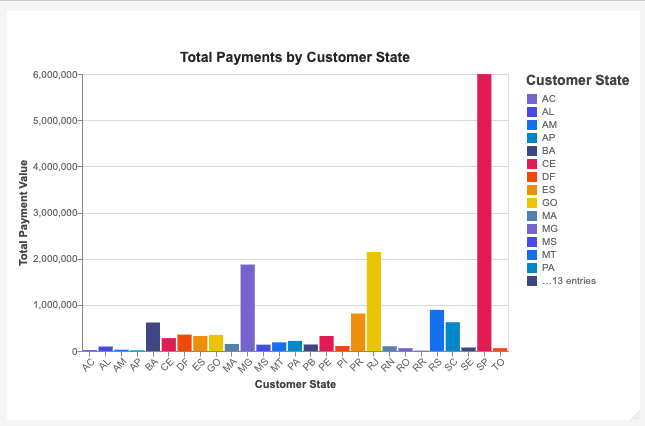
"question": "Show me total payments by customer state",
"sql": "SELECT customer_state, SUM(payment_value) AS total_payment_value FROM orders GROUP BY customer_state ORDER BY total_payment_value DESC",
"customInstruction": "Display as a pie chart",
"threadId": "75ab23c8-9124-4560-a125-fbe7e321dcba"
}Understanding arguments
- question: The original natural language query that was used to generate the SQL.
It reflects the user’s data intent, not a prompt for customizing the chart appearance. - sql: The actual SQL statement generated from the question, which retrieves the necessary data for visualization.
- customInstruction (optional)
Instructions for how the visualization should be adjusted (e.g., change chart type, rename title, filter top N).
This is separate from thequestion.
Response:
{
"id": "a9597146-03ee-4de7-bcd6-57d71bffe86a",
"vegaSpec": {
"$schema": "https://vega.github.io/schema/vega-lite/v5.json",
"config": {
"mark": {
"tooltip": true
},
"font": "Roboto, Arial, Noto Sans, sans-serif",
"padding": {
"top": 30,
"bottom": 20,
"left": 0,
"right": 0
},
"title": {
"color": "#262626",
"fontSize": 14
},
"axis": {
"labelPadding": 0,
"labelOffset": 0,
"labelFontSize": 10,
"gridColor": "#d9d9d9",
"titleColor": "#434343",
"labelColor": "#65676c",
"labelFont": " Roboto, Arial, Noto Sans, sans-serif"
},
"axisX": {
"labelAngle": -45
},
"line": {
"color": "#1570EF"
},
"bar": {
"color": "#1570EF"
},
"legend": {
"symbolLimit": 15,
"columns": 1,
"labelFontSize": 10,
"labelColor": "#65676c",
"titleColor": "#434343",
"titleFontSize": 14
},
"range": {
"category": [
"#7763CF",
"#444CE7",
"#1570EF",
"#0086C9",
"#3E4784",
"#E31B54",
"#EC4A0A",
"#EF8D0C",
"#EBC405",
"#5381AD"
],
"ordinal": [
"#7763CF",
"#444CE7",
"#1570EF",
"#0086C9",
"#3E4784",
"#E31B54",
"#EC4A0A",
"#EF8D0C",
"#EBC405",
"#5381AD"
],
"diverging": [
"#7763CF",
"#444CE7",
"#1570EF",
"#0086C9",
"#3E4784",
"#E31B54",
"#EC4A0A",
"#EF8D0C",
"#EBC405",
"#5381AD"
],
"symbol": [
"#7763CF",
"#444CE7",
"#1570EF",
"#0086C9",
"#3E4784",
"#E31B54",
"#EC4A0A",
"#EF8D0C",
"#EBC405",
"#5381AD"
],
"heatmap": [
"#7763CF",
"#444CE7",
"#1570EF",
"#0086C9",
"#3E4784",
"#E31B54",
"#EC4A0A",
"#EF8D0C",
"#EBC405",
"#5381AD"
],
"ramp": [
"#7763CF",
"#444CE7",
"#1570EF",
"#0086C9",
"#3E4784",
"#E31B54",
"#EC4A0A",
"#EF8D0C",
"#EBC405",
"#5381AD"
]
},
"point": {
"size": 60,
"color": "#1570EF"
}
},
"title": "Total Payments by Customer State",
"data": {
"values": [
{
"customer_state": "PR",
"total_payment_value": 811156.379999998
},
{
"customer_state": "BA",
"total_payment_value": 616645.8200000012
},
{
"customer_state": "RJ",
"total_payment_value": 2144379.68999999
},
{
"customer_state": "SE",
"total_payment_value": 75246.25
},
{
"customer_state": "TO",
"total_payment_value": 61485.32999999993
},
{
"customer_state": "AP",
"total_payment_value": 16262.8
},
{
"customer_state": "SC",
"total_payment_value": 623086.43
},
{
"customer_state": "PA",
"total_payment_value": 218295.85
},
{
"customer_state": "MT",
"total_payment_value": 187029.28999999986
},
{
"customer_state": "AL",
"total_payment_value": 96962.06000000003
},
{
"customer_state": "RN",
"total_payment_value": 102718.13
},
{
"customer_state": "AC",
"total_payment_value": 19680.62
},
{
"customer_state": "GO",
"total_payment_value": 350092.3100000009
},
{
"customer_state": "ES",
"total_payment_value": 325967.55000000045
},
{
"customer_state": "AM",
"total_payment_value": 27966.93
},
{
"customer_state": "MS",
"total_payment_value": 137534.84000000003
},
{
"customer_state": "RR",
"total_payment_value": 10064.62
},
{
"customer_state": "PI",
"total_payment_value": 108523.97000000003
},
{
"customer_state": "SP",
"total_payment_value": 5998226.959999885
},
{
"customer_state": "MG",
"total_payment_value": 1872257.2600000093
},
{
"customer_state": "DF",
"total_payment_value": 355141.0799999998
},
{
"customer_state": "MA",
"total_payment_value": 152523.02000000002
},
{
"customer_state": "RS",
"total_payment_value": 890898.5399999967
},
{
"customer_state": "CE",
"total_payment_value": 279464.0300000001
},
{
"customer_state": "PE",
"total_payment_value": 324850.4399999999
},
{
"customer_state": "PB",
"total_payment_value": 141545.7199999999
},
{
"customer_state": "RO",
"total_payment_value": 60866.2
}
]
},
"mark": {
"type": "bar"
},
"width": "container",
"height": "container",
"autosize": {
"type": "fit",
"contains": "padding"
},
"encoding": {
"x": {
"field": "customer_state",
"type": "nominal",
"title": "Customer State"
},
"y": {
"field": "total_payment_value",
"type": "quantitative",
"title": "Total Payment Value"
},
"color": {
"field": "customer_state",
"type": "nominal",
"title": "Customer State",
"scale": {
"range": [
"#7763CF",
"#444CE7",
"#1570EF",
"#0086C9",
"#3E4784",
"#E31B54",
"#EC4A0A",
"#EF8D0C",
"#EBC405",
"#5381AD"
]
}
},
"opacity": {
"condition": {
"param": "hover",
"value": 1
},
"value": 0.3
}
},
"params": [
{
"name": "hover",
"select": {
"type": "point",
"on": "mouseover",
"clear": "mouseout",
"fields": [
"customer_state"
]
}
}
]
},
"threadId": "bfbef4db-5bb4-4133-a65f-9dd813569727"
}Try copying this spec into the Vega Editor and you'll see a chart like this:
Error Handling
If chart generation fails, you'll receive an error response:
{
  "id": "c4f82c31-a40d-4b8e-9e5f-c1d8a742db55",
  "code": "INVALID_SQL",
  "error": "Unable to generate chart: SQL query does not return valid data for visualization"
}
Supported Chart Types
Check Wren AI / Generate Chart for reference.